The University of Edinburgh Transport Office wrote on their website
Data from the Meteorological Office show the chance of getting wet on a typical ten-minute cycle journey is one in fifty!
to encourage people to use the bike to go to uni. Well, I’m going by bike, but I was always suspicious about this statistic. So I decided to set up my own.
For Edinburgh
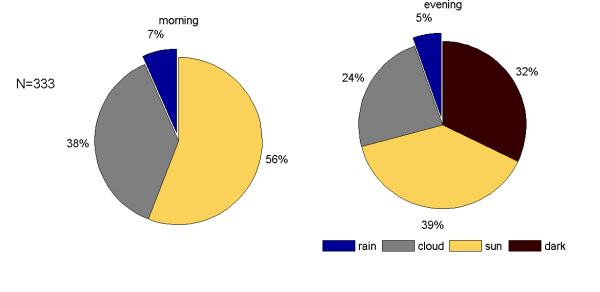
Clearly I haven’t got as extensive data as the Met Office, but here is what I have collected during my stay in Edinburgh (23/10/2006 to 29/03/2010):
 The main point of the statistic is to show what the chance is to get wet on a bike ride to uni. The diagrams show the frequency of the four different conditions for the ride to uni (morning) and back (evening). The times of my rides may vary considerably (I’d say the mean is approximately 09:45 and 18:00), but this is not important. N is the number of days that I have recorded. The four conditions are mutually exclusive and are defined as follows
- rain: crucial is that I got wet, or that there was the potential to get wet, i.e. if I delay my bike ride because it is raining, it counts as rain, but if I go and there is only high humidity with tiny drops of rain such that the clothes only get damp, it doesn’t count as rain
- dark: it is dark, but there is no rain
- sun: clouds must not cover the view to at least part of the sun, if the sun is covered by buildings during the whole ride, but it obviously shines, it counts as sun; if the sun gets covered during the ride, it still counts as sun; if there is sun and rain at the same time (yes, happens!), it counts as rain
- cloud: neither rain, sun or dark
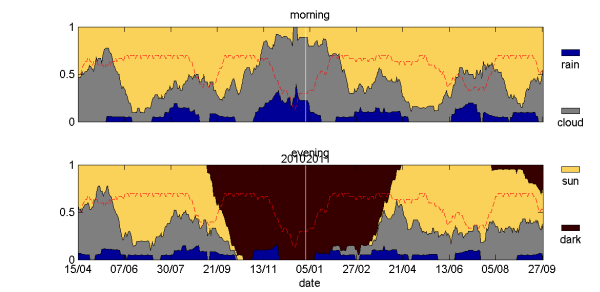
Clearly, there should be less rain in July than there is in April. Is that really so? To find out I also look how the percentages of rain, cloud, sun and darkness change over time within 30 day periods. Each data point in the figure below summarises the weather conditions within 30 days. The date given is the 15th day in the period, i.e. the data point at 20/11 shows the weather for the period from 06/11 to 05/12. Because I’m not cycling every day (e.g. only weekdays), the number of journeys used to calculate the percentages is lower than 30. The red, dashed line shows the fraction of journeys (from 30) that I used to calculate for the given date. The lower the curve, the less reliable the percentages.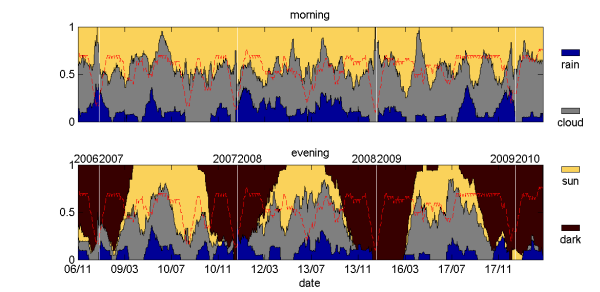
Finally, there is one important weather factor missing that can determine whether cycling is pleasant or not: wind. Especially in Scotland one should be aware that winds can easily and regularly get so strong that you get pushed sidewards on the road. There were a couple of days with really strong winds, but I didn’t record wind conditions, because I found it hard to make objective judgements just from experiencing it while cycling.
You can get the raw data and the Matlab files that I use to create the diagrams (fahrradwetterstatistik.m, plotWeatherArea.m and plotWeatherPie.m).
Conclusion
Well, what do we learn from this data? The chance of getting wet while going to work in Edinburgh was roughly 1/10 and not 1/50 as stated by Edinburgh Uni. However, these numbers do not tell how wet you’ll get, when going through the rain. The good thing is that you often don’t get seriously wet, because the most common form of rain in Edinburgh is rather light. Consequently, even with the higher chance of getting wet, the rain is not a good excuse for not cycling in Edinburgh. A better excuse is the lack of dedicated cycle lanes throughout the city, but that’s a different story.
Can we draw any other conclusions from the data? It is interesting that it rained more in the morning than in the evening. I haven’t carried out the statistical test, but given the number of data points I’d guess that the effect is significant. Similarly, it was considerably more often cloudy (including rainy) than sunny. Is that the explanation for why the weather in Edinburgh is perceived as miserable, particularly during the summer? I’m not convinced. Personally, I think this has more to do with the cold temperatures. We can only gain more insight into this data when comparing it against that of other cities.
For Leipzig
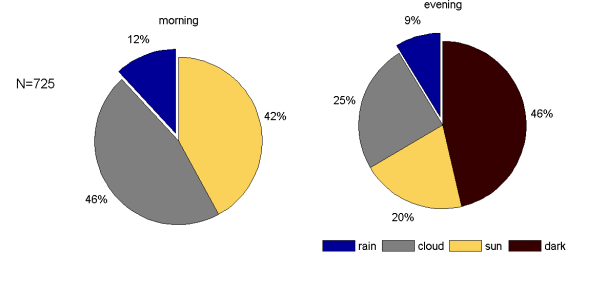
With my relocation to Leipzig I also got the chance to compare the Fahrradwetterstatistik of Edinburgh to that of a city with continental climate. I will use exactly the same definitions and analyses as above. Here is what I’ve got (01/04/2010 to 13/10/2011):